A reporting Gantt chart visualises any combination of schedule data—whether internal (e.g. XECUTE equipment schedules) or external (e.g. rail, stockyard, or blasting schedules). Reports can be configured to focus on a single schedule or display multiple schedules concurrently.
For example:
An equipment schedule can show when each resource performs a task, along with scheduled quantities, sources, and destinations.
Simultaneously, a rail schedule could show when trains are loaded, their destination ports, and their capacities.
Other types of schedules displayed could include stockpile builds and fixed plant maintenance.
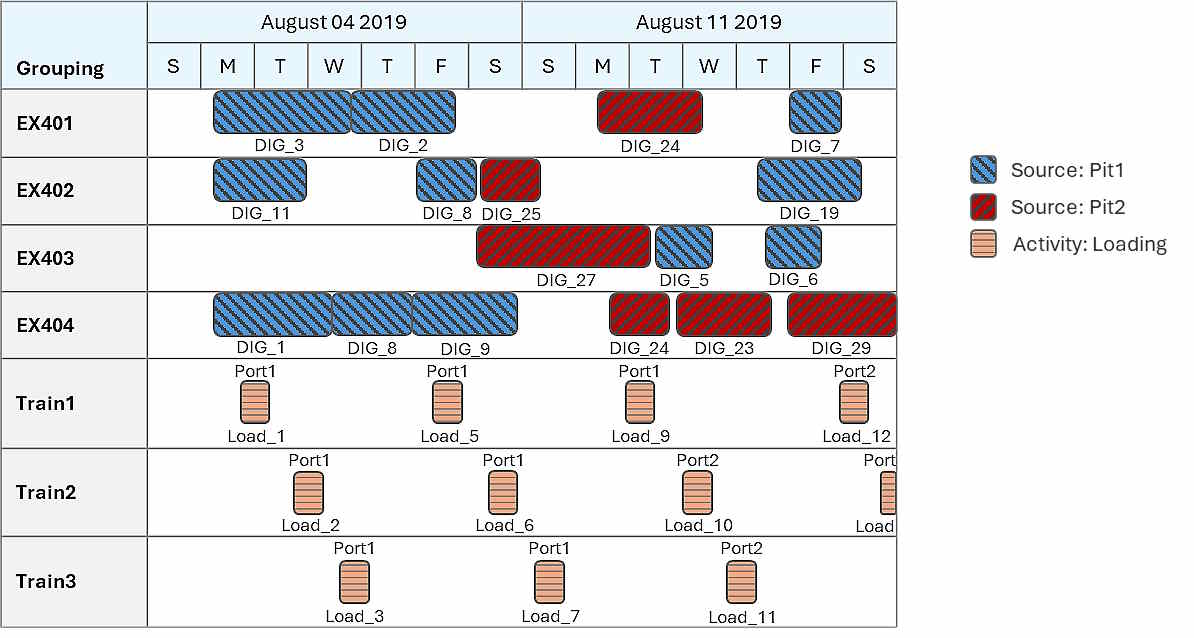
The chart supports conditional styling, which define rules that apply specific styles to task bars based on field values. For example, a rule might target tasks where the source is Pit1, applying a forward-diagonal orange pattern to those bars. You can also organise the report layout by grouping rows according to relevant criteria. For instance, if each row represents a resource, resources can be grouped by the type of activity they perform.
An example Gantt chart. It includes the internal XECUTE equipment schedule and an external rail schedule.
All task bars in the Gantt chart—regardless of their originating schedule—use a shared set of report fields. These fields provide a consistent structure for reporting across multiple schedules. At a minimum, each task must define its name, start date, and finish date. Additional fields can be mapped to provide further detail, such as quantities for tooltips, sources and destinations for labels, or activity types for sorting and grouping. Each schedule maps its internal fields to the report fields to derive values.
You create and manage reports using the report configuration. Within a configuration, you:
Select schedules to report on—the internal XECUTE schedule or an external one (e.g., rail, stockyard, blasting)—the associated tasks to be plotted.
Define and map report fields, including mandatory fields (item/resource, start, finish) and optional fields (quantities, sources, destinations…). These fields are mapped to schedule-specific fields to derive task values.
Control the chart visualisation, including task bar styling, overall theme, and grouping logic (e.g., grouping rows by resource or activity type).
Add detail with labels and tooltips.
Click Configure ![]() to open the configuration options.
to open the configuration options.
Use the options on the toolbar to manage the Gantt reports.
Select a report from the list to open and edit.
![]() Add a new report.
Add a new report.
![]() Remove the selected report.
Remove the selected report.
![]() Save changes to the current report.
Save changes to the current report.
![]() Save As to create a copy of the current report.
Save As to create a copy of the current report.
![]() Toggle refresh mode to choose between automatic updates when data changes or manual refresh via the button.
Toggle refresh mode to choose between automatic updates when data changes or manual refresh via the button.
Report fields define the data that’s displayed on a Gantt chart.
Mandatory fields defined the name of the evaluated item – and the start and end dates of the item’s tasks.
Optional fields provide additional detail, which can be used for grouping, labelling, tooltips, and sorting.
On the Report Fields subtab, you define the structure of the fields you want to include in the report.
There are five system-defined fields:
Start: The start date/time of the evaluated record/item (i.e., a task, stockpile, resource…).
Finish: The finish date/time of the item.
Name: The name of the record.
Input Type: Indicates whether the item originates from an external source or the internal XECUTE schedule.
This field will be hidden and is managed by the software. However, you can reference it in bar rendering and tooltip rules if those rules should depend on the input type.
Input Data Rule: Specifies the rule used to locate and map the input data.
This field will also be hidden.
Start, Finish, and Name are required for all Gantt chart records.
If you’re targeting an external schedule, it must contain equivalent fields:
Start and Finish must represent the date and time when a record begins and ends.
Name must represent the name of the record.
The internal XECUTE schedule already has these equivalent fields.
Each report field is defined as a row in the configuration. The configuration controls how each field will be interpreted. For each field, you specify:
Field Name: The label or identifier for the field.
Data Type: The type of data (e.g., DateTime, Text, Numeric, Boolean).
Aggregation Type: Controls how values are summarised when multiple records are grouped. (varies by data type).
Numeric: Sum, Min, Max, Weighted Average, Average
Text: None
DateTime: Earliest, Latest
Boolean: None
Weighting Field (optional): Used for weighted aggregations (e.g., weight average for numeric fields).
By default, only the essential Start, Finish, and Resource fields are available. However, to add more detail to the chart, you can define custom fields such as:
Quantity (numeric value representing task volume)
TaskName (Descriptive identifier for the activity)
Source (Location where activity was performed)
Destination (Location where activity finishes or material is sent to)
Custom fields can be mapped to corresponding attributes in the internal or external schedules. Once mapped, they can be used to group tasks or referenced in bar rendering rules, labels, and tooltips.
Use the field manager tools ![]()
![]() to create and configure additional fields as needed.
to create and configure additional fields as needed.
Refer to the section below for examples of custom fields.
On the Gantt Reporting tab, a new chart is created. On the Report Fields subtab, the following fields are defined:
|
Field Name |
Data Type |
Aggregation Type |
Weighting Field |
|---|---|---|---|
|
Start |
Date Time |
Earliest |
|
|
Finish |
Date Time |
Earliest |
|
|
Input Type |
Text |
None |
|
|
Input Data Rule |
Text |
None |
|
|
Name |
Text |
None |
|
|
Activity |
Text |
None |
|
|
Quantity |
Numeric |
Sum |
|
|
Source |
Text |
None |
|
|
Adjusted Quantity |
Numeric |
Sum |
|
The report fields used to evaluate the scheduling data.
Their values will derive from the external schedule. Start, Finish and Name (orange) are mandatory. Input Type and Input Data Rule (dark orange) are managed behind-the-scenes. The other fields are custom, used to add greater reporting detail.
Once you’ve defined your report fields, the next step is to connect them to actual data on the Input Data subtab. This involves:
Retrieving the tasks to be reported.
Mapping data values to the report fields.
You perform this by preparing input data rules.
An input data rule defines how schedule data is sourced and interpreted for reporting. Each rule performs the following functions:
Identifies the data source, which can be the internal XECUTE schedule, an external schedule, or calendar data from the site.
Extracts tasks or records from the specified source.
Maps report fields by assigning values to each field based on corresponding fields in the target schedule.
A Gantt chart can incorporate multiple input data rules, each sourcing data from a distinct schedule. This enables side-by-side reporting of different scheduling datasets within a single chart view.
For example, a report could detail two schedules:
One schedule is the internal schedule, focusing on the extraction of activity areas.
Another could derive from an external source and focus on blasting operations.
Displaying both in the same chart helps identify conflicts and coordinate blast windows for safety.
For more information, refer to the Report multiple schedules below.
Within a rule, to use data from the internal schedule, set Input Data Source to Internal Schedule.
Within a rule, you locate an external schedule by:
Setting Input Data Source to External Schedule
Selecting an external schedule in Data Feed In.
The external schedule must be configured as a profile in Config > Data Feed In, with:
Data Type set to External Schedule.
Data source linked to the correct repository
Definition linked to the correct field structure.
In Config > Data Feed In, a profile named My External Schedule is created.
|
My External Schedule |
|
|
Name |
My External Schedule |
|
Is active |
Yes |
|
Data type |
External Schedule |
|
Data source |
\Schedules\MyScheduleData |
|
Definition |
MyScheduleDefinition |
|
Data Set |
<Latest> |
|
Mappings |
|
|
Resource Name |
Resource |
|
Scheduled Start Time |
TaskStart |
|
Scheduled End Time |
TaskFinish |
This example will be continuously built on throughout the sections below.
An external schedule consists of two main components: a definition and a dataset.
The definition outlines the structure of the dataset. It includes:
A field list: Specifies the fields that describe each record. At a minimum, the definition must include fields equivalent to ResourceName, TaskStart, and TaskFinish.
Field properties:
Name: Identifier used in expressions and field mappings.
Description: Brief explanation of the field’s purpose.
Data Type: Specifies the type of data stored (Text, Numeric, or DateTime).
Key field:
Serves as the primary identifier for each record.
It ensures that each row in the dataset is unique.
Let’s assume an external schedule is structured using a definition named MyScheduleDefinition. The definition is shown below.
|
Field Type |
Name |
Description |
Data Type |
|---|---|---|---|
|
Key |
TaskName |
Name of the mining block being mined |
Text |
|
Field |
Resource |
Name of the resource performing the task |
Text |
|
Field |
TaskStart |
Date and time when the task begins |
Date |
|
Field |
TaskFinish |
Date and time when the task ends |
Date |
|
Field |
Activity |
Type of activity being performed |
Text |
|
Field |
Quantity |
Quantity of material mined or moved |
Numeric |
|
Field |
Source |
Name of the source location |
Text |
|
Field |
Level |
Elevation level of the mining block |
Numeric |
A dataset definition, providing the structure for fields to be referenced in the Gantt chart.
Resource, TaskStart, TaskFinish (highlighted in orange) are required. These fields allow the software to determine what is performing each task, when the task begins, and how long it runs for. TaskName (highlighted in blue) uniquely identifies each record (e.g., DIG_1, DRL_1). It ensures that each task is distinct and traceable within the dataset.
The dataset contains the actual records to be reported, such as tasks, stockpiles, or resources. A record contains a value for each field in the definition.
The data source, MyScheduleData, contains the records to be reported:
|
TaskName |
Resource |
TaskStart |
TaskFinish |
Activity |
Quantity |
Source |
Level |
|---|---|---|---|---|---|---|---|
|
DIG_18 |
PC5503 |
08/15/2019 08:27:28 AM |
08/16/2019 08:27:28 AM |
Mining |
1675.51 |
Pit1 |
1100 |
|
DIG_2 |
PC5501 |
08/16/2019 12:51:18 AM |
08/17/2019 12:51:18 AM |
Mining |
2770.37 |
Pit1 |
1100 |
|
DIG_20 |
PC5503 |
08/13/2019 11:27:50 AM |
08/14/2019 11:27:50 AM |
Mining |
1074.45 |
Pit1 |
1100 |
|
DIG_19 |
PC5502 |
08/26/2019 12:28:34 AM |
08/29/2019 12:28:34 AM |
Mining |
1630.56 |
Pit1 |
1100 |
|
DIG_7 |
PC5502 |
08/22/2019 10:43:24 AM |
08/25/2019 10:43:24 AM |
Mining |
4737.94 |
Pit1 |
1100 |
|
DRL_14 |
Rig500 |
08/09/2019 05:41:12 AM |
08/10/2019 05:41:12 AM |
Drilling |
460.38 |
Pit1 |
1100 |
|
DIG_3 |
PC5501 |
08/06/2019 08:05:09 PM |
08/07/2019 08:05:09 PM |
Mining |
3792.00 |
Pit1 |
1100 |
|
DIG_4 |
PC5503 |
08/04/2019 02:16:46 PM |
08/05/2019 02:16:46 PM |
Mining |
3157.09 |
Pit1 |
1100 |
|
DIG_8 |
PC5503 |
08/29/2019 11:04:10 AM |
09/01/2019 11:04:10 AM |
Mining |
2588.80 |
Pit1 |
1100 |
|
DIG_12 |
PC5503 |
09/04/2019 08:33:26 AM |
09/06/2019 08:33:26 AM |
Mining |
3179.92 |
Pit1 |
1100 |
|
DIG_14 |
PC5502 |
08/10/2019 05:00:07 AM |
08/11/2019 05:00:07 AM |
Mining |
4160.40 |
Pit1 |
1100 |
|
DIG_6 |
PC5503 |
08/07/2019 08:21:53 AM |
08/09/2019 08:21:53 AM |
Mining |
4536.81 |
Pit2 |
1090 |
|
DIG_17 |
PC5502 |
09/02/2019 03:48:12 PM |
09/03/2019 03:48:12 PM |
Mining |
1947.66 |
Pit2 |
1090 |
|
DRL_3 |
Rig500 |
08/04/2019 03:07:09 PM |
08/07/2019 03:07:09 PM |
Drilling |
409.63 |
Pit2 |
1090 |
|
DIG_16 |
PC5502 |
08/15/2019 06:13:10 AM |
08/17/2019 06:13:10 AM |
Mining |
4603.97 |
Pit2 |
1090 |
Each row represents a scheduled task.
The Calendar Data input source extracts information from the site’s operational calendar, covering period details, production rates, and custom-defined fields.
It may include:
Period details (such as names, start/end dates, and durations)
Custom calendar field values
Material flow node production rates (such as stockpile reclaim rates, dump stack rates, and throughput rates like crusher processing rates).
You can add production rates and custom fields like equipment outages to the Gantt chart to visualise when each is active and how they align or overlap over time.
Once the schedule data is loaded (internal or external), the report fields must be mapped to a value for every record. This is achieved using expressions, which define how values are derived.
The expression can be:
Direct references, pointing directly to a field in the schedule (e.g., ActivityName).
Calculated formulas, using functions, operators, and fields to compute values (e.g., Volume * 1.1 to apply a swell factor).
Use the Expression Builder ![]() to create these mappings. It provides:
to create these mappings. It provides:
A list of all available fields in the selected source.
The expected return type for each report field (e.g., DateTime, Numeric, Text).
Double-click to insert fields into the expression.
To ensure correct task visualisation in the Gantt chart, three default report fields must be properly mapped. These fields control how tasks are plotted on the timeline and how they are grouped and labelled.
Start: Maps to the start date and time of each record. This determines when the task begins on the timeline.
Finish: Maps to the end date and time of each record or task. This defines when the task finishes.
Name: Maps to the field that identifies what is being scheduled. This represents the item evaluated in each Gantt row. (For example, if the item is Resource, each row represents a resource and uses bars to show when the resource performs a task.)
You can reconfigure and refine the bar groupings using the Visualisation options.
Start and Finish must return valid DateTime values that fall within the active calendar’s period range. Otherwise, the tasks will not appear in the Gantt chart.
When working with an external schedule, report fields can be mapped using any of the available fields defined in the external schedule’s dataset. This gives you full access to its data for use in expressions.
In the external schedule profile (prepared in Config > Data Feed In), three system fields were previously mapped:
|
System field |
Description |
|---|---|
|
Resource Name |
Mapped to the external field containing resource names. |
|
Scheduled Start Time |
Mapped to the external field indicating when a task begins. Sets the start point of a record on the Gantt chart. |
|
Scheduled End Time |
Mapped to the external field indicating when a task ends. Sets the end point of a record on the Gantt chart. |
These fields are available in the input data rules’ Expression Builder, directly returning the mapped field’s value.
For example:
If ResourceName was mapped to Resource, the expression Resource will return the correct values.
If ScheduledStartTime was mapped to TaskStart, the expression TaskStart will return the correct start times.
We recommend mapping the Start and Finish report fields to the ScheduledStartTime and ScheduledEndTime system fields.
If these fields aren’t mapped properly, the external schedule data won’t load correctly into the Gantt chart.
When working with the internal XECUTE schedule, you can map the report fields using any of the fields within the schedule.
For a list of all fields, see Field References.
On the Input Data tab, a rule is created – connecting to the My External Schedule profile.
Most expressions simply map the report field to an equivalent external schedule field. However, one field references an external schedule field and modifies it to derive a value.
|
Field Name |
Data Type |
Expression |
|---|---|---|
|
Start |
Date Time |
ScheduledStartTime |
|
Finish |
Date Time |
ScheduledEndTime |
|
Name |
Text |
ResourceName |
|
Task |
Text |
TaskName |
|
Activity |
Text |
Activity |
|
Quantity |
Numeric |
Quantity |
|
Source |
Text |
Source |
|
Adjusted Quantity |
Numeric |
Quantity * 1.1 |
Mapping the report fields to fields within the external schedule
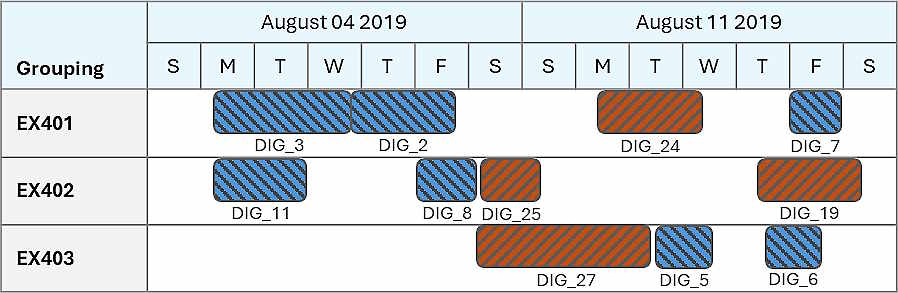
At this stage, the report looks like this:
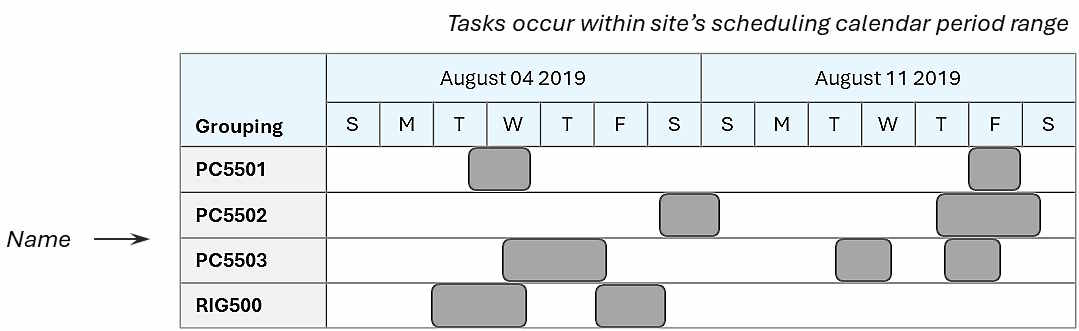
The Gantt chart so far, looking at the first two weeks, taking data from an external schedule.
The mapped Start and End fields determine the start and end dates of each record.
The mapped Name field determines the item evaluated in each Gantt row.
The Visualisation subtab controls how Gantt rows are grouped and visualised.
The Grouping section determines how rows are structured in the Gantt chart. It defines which report fields are used to organise the chart’s timeline bars.
When you select a field—such as Resource—as the primary (first) grouping, the Gantt chart creates one row for each unique value in that field. For example, if the targeted schedules contain scheduled tasks for multiple resources, selecting Resource as the primary group will result in a row for each resource. The chart then displays bars along each row, showing when that resource is scheduled based on the Start and Finish fields.
In the example below, Resource is the primary grouping field.
The Gantt chart
|
Field Name |
Sorting Expression |
|---|---|
|
Name |
Name |
The grouping setup
By default, the mapped field Name (set up on the Input Data subtab) is the primary grouping. However, this can be changed.
You can add additional grouping levels to create subrows under each primary group.
For instance, if you add Source as a second grouping level, the chart will display a row for each source location under each resource – showing the location where the activity was performed.
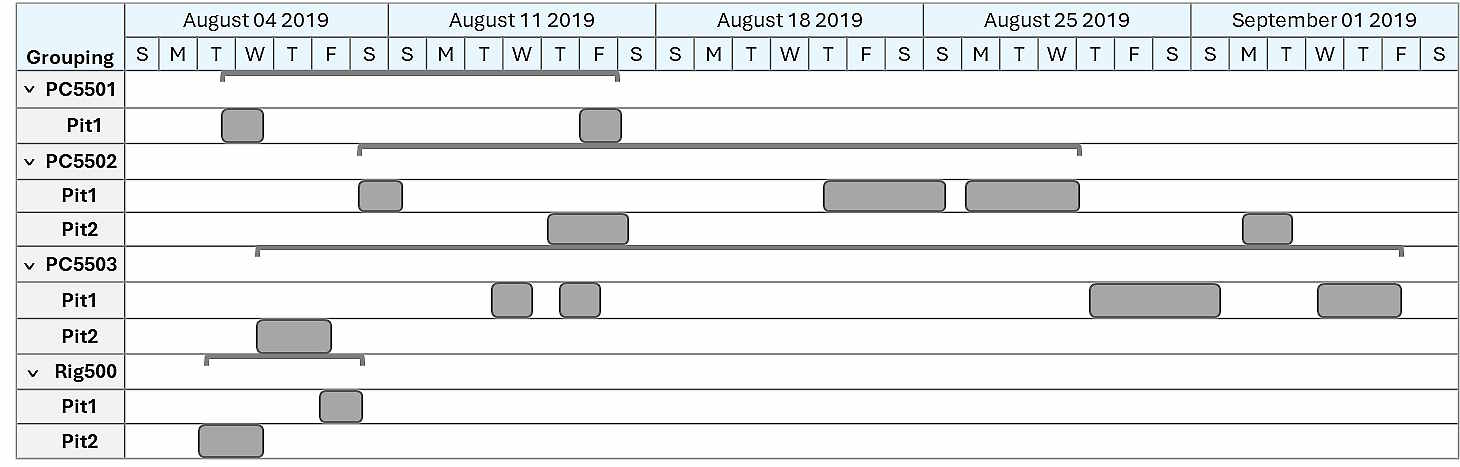
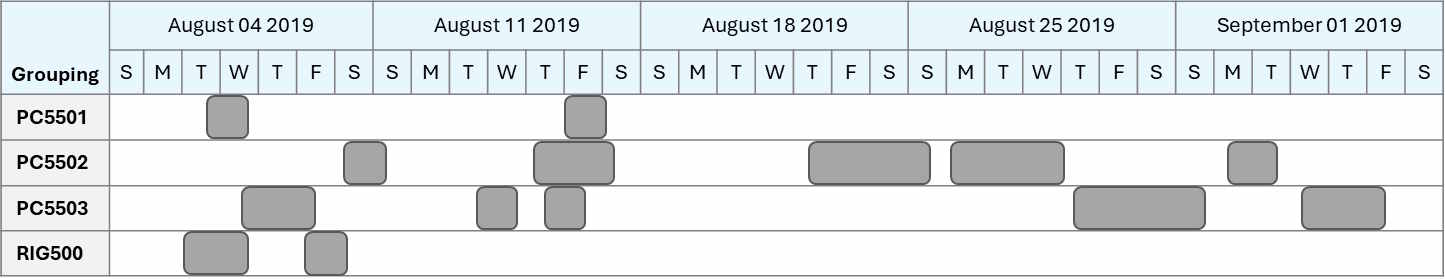
The Gantt chart
|
Field Name |
Sorting Expression |
|---|---|
|
Name |
Name |
|
Source |
Source |
The grouping setup
Summary brackets or group duration indicators highlight the total time the evaluated item (i.e., a resource) is active within its subgroups, such as across different sources.
This hierarchical structure helps you visualise not just who is doing the work, but also when and where.
Click Add Grouping ![]() to create a new grouping level. Click Remove
to create a new grouping level. Click Remove ![]() to delete the selected grouping.
to delete the selected grouping.
Grouping levels are nested based on their order in the list:
The first group defines the primary row in the Gantt chart (e.g., Resource).
Each subsequent group creates subrows under the previous level (e.g., Location under Resource).
This hierarchy controls how tasks are organised and displayed in the chart.
The Timeline subtab controls the overall time configuration of the Gantt chart.
|
Timeline |
|
|
Bar Merging |
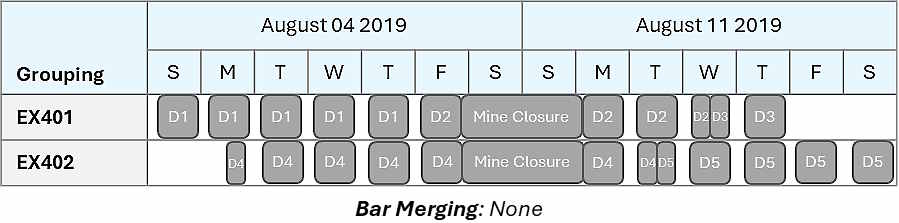
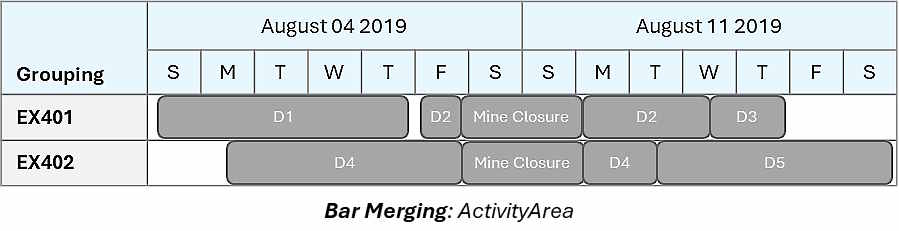
Controls whether adjacent records (bars) with the same value in a specified field are visually merged into a single bar on the Gantt chart Bar merging is especially useful when tasks are frequently interrupted, such as by shift changes or short maintenance windows. It provides a cleaner, more continuous view of activity.
Merging records that are frequently interrupted by shift change delays. The software identifies adjacent bars with a common value—in this case, the same activity area—and merges them into a single continuous bar. From the list:
|
|
Timeline |
|
|
Time Period |
Adjusts the zoom level of the Gantt chart’s timescale, allowing you to view time in finer (e.g., minutes, hours) or broader (e.g., days, weeks, months) granularity. For more information, refer to Gantt Chart > Granularity Levels. |
|
Start Date |
Controls when the Gantt chart timeline begins.
|
|
Finish Date |
Controls the date at which the Gantt chart ends.
|
|
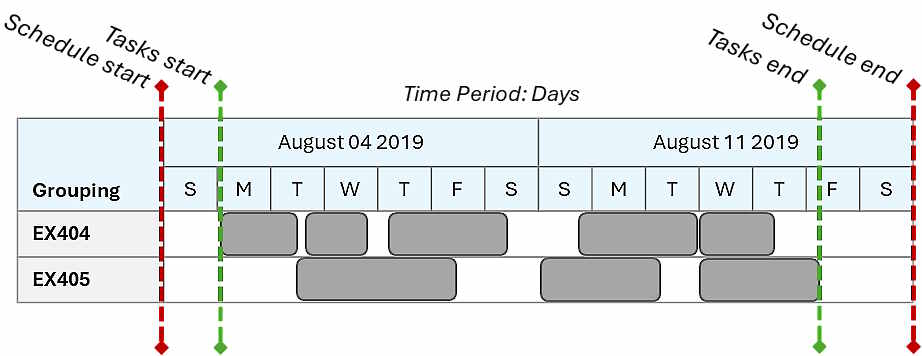
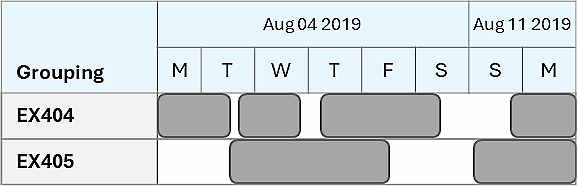
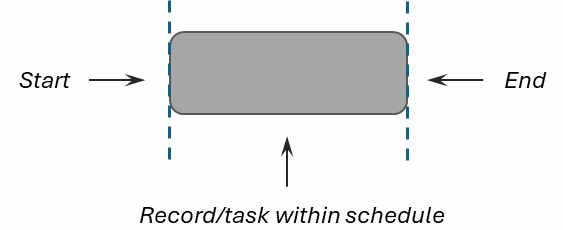
An illustration of the Timeline properties
In this example, the start date is the beginning of all tasks and the end date is manually specified |
|
|
Theme |
|
|
Theme |
Applies a theme to the Gantt chart.
|
The Bar Rendering Rules subtab controls how bars (records) are visually represented on the Gantt chart. Each rule defines a set of visual properties that determine the appearance of the bars it applies to. You can create multiple rules, each with different styling options.
Bars are assigned to a rule based on the rule’s Boolean filter expression. This expression is evaluated against all bars on the chart. If a bar satisfies the condition (i.e. the expression returns True), it’s allocated to that rule and rendered using the rule’s visual settings.
A stylised Gantt chart
|
Property |
Rule1 |
Rule2 |
|---|---|---|
|
Filter Expression |
Source = "Pit1" |
Source = "Pit2" |
|
Bar Style |
|
|
|
Label1 Text Position |
Below |
Below |
|
Label1 Text Expression |
TaskName |
TaskName |
The configuration of the rules to stylise the chart
In this example, bars are assigned to rendering rules based on the value of their Source field. A bar with a value of Pit1 is assigned to Rule1, while a value of Pit2 assigns it to Rule2.
Rule1 bars are styled with a blue backward diagonal pattern.
Rule2 bars use an orange forward diagonal pattern.
All bars are labelled with their task name from the TaskName field, with labels positioned below the bars.
|
Bar Rendering Rule |
|
|
Rule Name |
Defines the name of the rule. |
|
Is Active |
Defines whether the rule is enabled. |
|
Filter Expression |
A Boolean expression used to evaluate each bar (record) on the chart. It checks the bar’s field values—derived from the report fields—and determines whether the bar meets the specified conditions. If the expression returns True, the bar is assigned to the corresponding rendering rule and styled accordingly. Use the Expression Builder to create the expression. It provides a list of all report fields available for each bar (record), which you can reference. You can also incorporate functions and operators to build more complex conditions. |
|
Example bar styles |
|
|
Bar Colour |
|
|
Override Colour |
Defines whether a custom (Yes) or the default (No) colour is used to colour the rule’s bars. |
|
Colour |
Allocates a specific colour to the rule’s bars. |
|
Bar Pattern |
|
|
Override Pattern |
Defines whether a custom (Yes) or the default (No) pattern is used to stylise the rule’s bars. |
|
Pattern |
Defines the pattern of the rule’s bars. |
|
Pattern Colour |
Defines the secondary colour of the pattern. |
|
Bar Text Properties |
|
|
Override Text |
Defines whether the bars can be annotated (Yes) or not (No). |
|
You annotate bars by defining labels. A bar can have any number of labels. In the table, each row represents a label and defines where it’s positioned relative to the bar, the label name, and the text colour. Click Add |
|
|
Position |
Defines the position of the label relative to the bar. |
|
Text Expression |
An expression that automatically generates a label for each bar in the rule. It must return a Text value. In the Expression Builder, you can reference any of the bar’s report fields, as well as functions and operators to construct the expression. For example, the expression IIF(Quantity > 100, CStr(Quantity), "") displays the Quantity value only if it is greater than 100. The CStr function converts the numeric value to a string so that the result is compatible with the label format. |
|
Override Automatic Colour |
Defines whether a custom (Yes) or the default (No) colour is used to colour the label. |
|
Text Colour |
Allocates a specific colour to the label. |
Click Add Rule ![]() to create a new rule. Click Remove
to create a new rule. Click Remove ![]() to delete the selected rule.
to delete the selected rule.
A bar can have only one rule. If multiple rules apply, the bar uses highest listed rule on the tree.
The Tooltip subtab controls the tooltips on each bar. A rule defines a tooltip label and associates it with specific bars. You can create multiple rules, each with different tooltips targeting different bars.
Bars are assigned to a rule based on the rule’s Boolean filter expression. This expression is evaluated against all bars on the chart. If a bar satisfies the condition (i.e. the expression returns True), it’s allocated to that rule and inherits the rule’s tooltip.
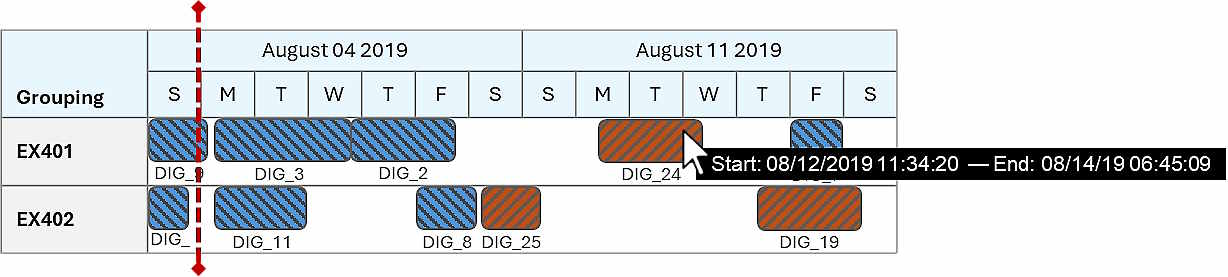
A tooltip on a bar
|
Property |
Dates Tooltip |
|---|---|
|
Filter Expression |
Start > #08/05/2019 06:13:10# |
|
Tooltip |
"Start: " + CStr(Start) + " — " + "End: " + CStr(Finish) |
Bars that start before the specified date will not inherit the rule’s tooltip.
The tooltip displays the task’s start and end dates and times.
|
Bar Rendering Rule |
|
|
Rule Name |
Defines the name of the rule. |
|
Is Active |
Defines whether the rule is enabled. |
|
Filter Expression |
A Boolean expression used to evaluate each bar (record) on the chart. It checks the bar’s field values—derived from the report fields—and determines whether the bar meets the specified conditions. If the expression returns True, the bar is assigned to this tooltip rule and will display the configured tooltip. Use the Expression Builder to create the expression. It provides access to all report fields for each bar, as well as functions and operators to build complex conditions. |
|
Tooltip |
An expression that defines the content shown in the tooltip for bars that meet the rule’s filter condition. It must return a text result. You can reference report fields and use expressions to dynamically populate the tooltip text. |
Click Add Rule ![]() to create a new rule. Click Remove
to create a new rule. Click Remove ![]() to delete the selected rule.
to delete the selected rule.
A bar can have only one rule. If multiple rules apply, the bar uses highest listed rule on the tree.
You can report on multiple schedules simultaneously by defining separate input data rules for each schedule. This allows you to compare and coordinate different operational plans within a single report.
For example, you could import the following schedules:
Internal XECUTE schedule, representing the equipment schedule (e.g., digging of activity areas).
External schedule: Schedule from EPF representing a rail schedule (e.g., train arrival, loading times).
External schedule: Includes stockyard builds or ship loading times.
By displaying all schedules together, you can see how all schedules align, such as whether equipment tasks finish in time for train loading. It allows you to see whether the schedules meaningfully coincide or if they need adjustments to prevent conflicts or delays across operations.
All schedules are reported using the same set of defined report fields. Each record in any schedule maps its internal data fields to the common report fields.
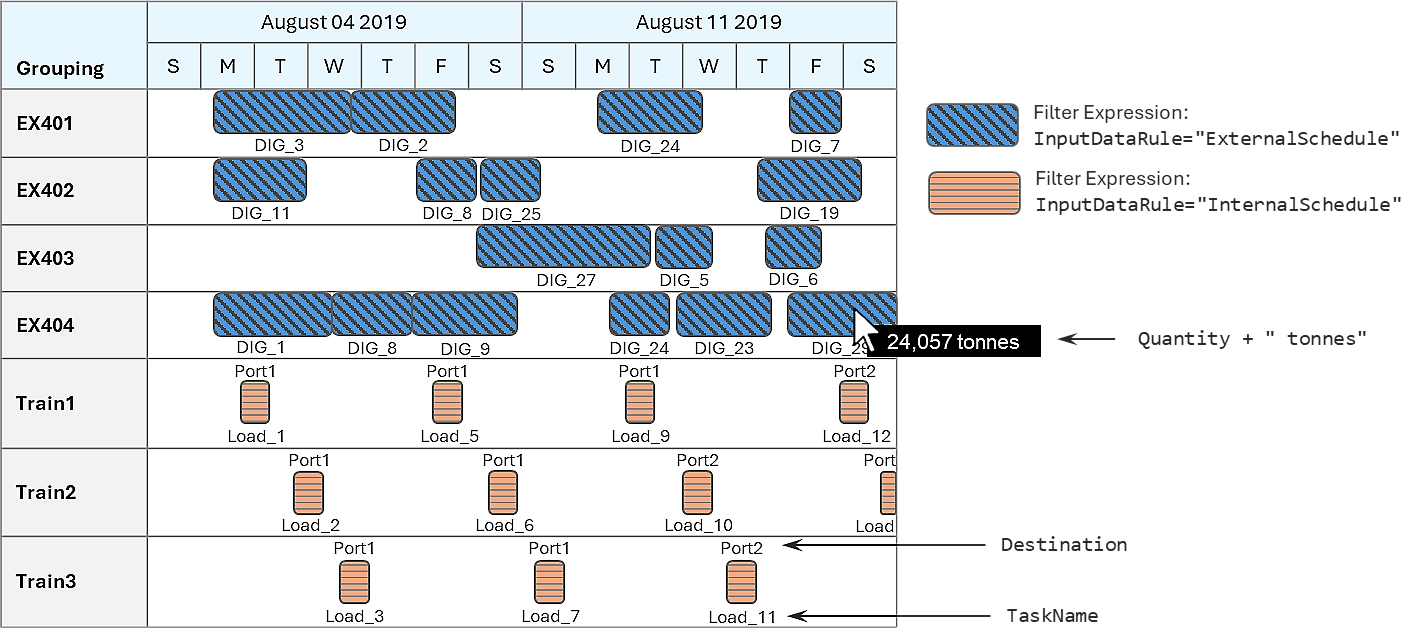
An example of reporting the internal schedule and an external schedule in the same Gantt chart